
Neither on-the-ground observation nor a basic data-driven analysis of high-transit use neighborhoods conclusively identify the factors driving transit use in Phoenix. Sprawl is so dominant as a residential pattern, however, that planners must focus not only on building transit-friendly neighborhoods but also on providing alternative transportation options in the decidedly transit-“unfriendly” subdivisions that make up Arizona’s […]
Tag Archives: statistics


Google’s Public Data Directory
Want to lose a couple of hours of your life playing with data visualizations? Then continue reading. I was recently snooping around for US Highway Statistics (yup, that’s what I do for fun) and came across the Federal Highway Administration’s statistics series web page. Falling deeper through the internet rabbit-hole, I found their Public Data […]
Yet Another Chart on Income Inequality
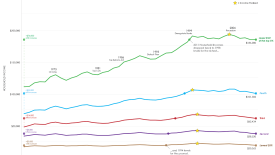
Not to compete with recent information from Mother Jones, Huffington Post, Reuters, the NY Times, and many others, I too pulled some US census data to look at how incomes have changed over the last 45 years. It was pretty easy to find and the census bureau had already broken the population into easily comparable segments (quintiles). […]
Best Cities to be an Urban Planner (and not have to explain what you do)
The profession of urban planning always befuddles my friends and relatives: “so are you like an architect or engineer” the question usually goes. If they have ever played the SimCity videogame, it is usually a little bit easier to explain what we do, and if shouting over the din of a bar, I respond “yeah, […]
Listmania: Best (and worst) Cities to Grab a Drink and Discuss Battlestar Galactica
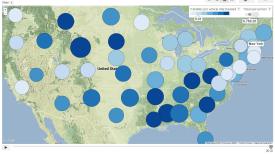
Overall, 31% of USA residents are between the ages of 25-34 and have a Bachelor’s Degree or higher. This is not too bad if you want to do some mad chilling nationally. But I wanted to see where these people were located and check out if there were any patterns (and see if the cities […]
Shootings Mapped
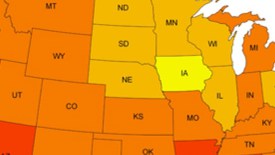
Due to the recent shooting in Colorado, it seemed appropriate to look at an older post from the Atlantic on the Geography of Gun Deaths by Richard Florida. These emotional moments are often points when people rally for policy changes, and I thought it might be interesting to look at the discussion surrounding data about […]


